-
Fixed Income Perspectives
Bonds Hold Steady Amid Volatility
June 2025
- Filename
- Fixed Income Perspectives June 2025.pdf
- Format
- application/pdf

TRANSCRIPT
The fixed income markets continue to face bouts of volatility with investors navigating the frequent shifts in tariff policy and concerns about increased deficits from the budget bill working its way through Congress. While the underlying macroeconomic environment remains stable and supported by durable consumer activity and a steady labor market, concerns over the deficit and declines in the U.S. dollar are putting pressure on long-end yields. On the other hand, both short and intermediate maturities continue to be met with strong demand.
Fixed Income Asset Class Performance
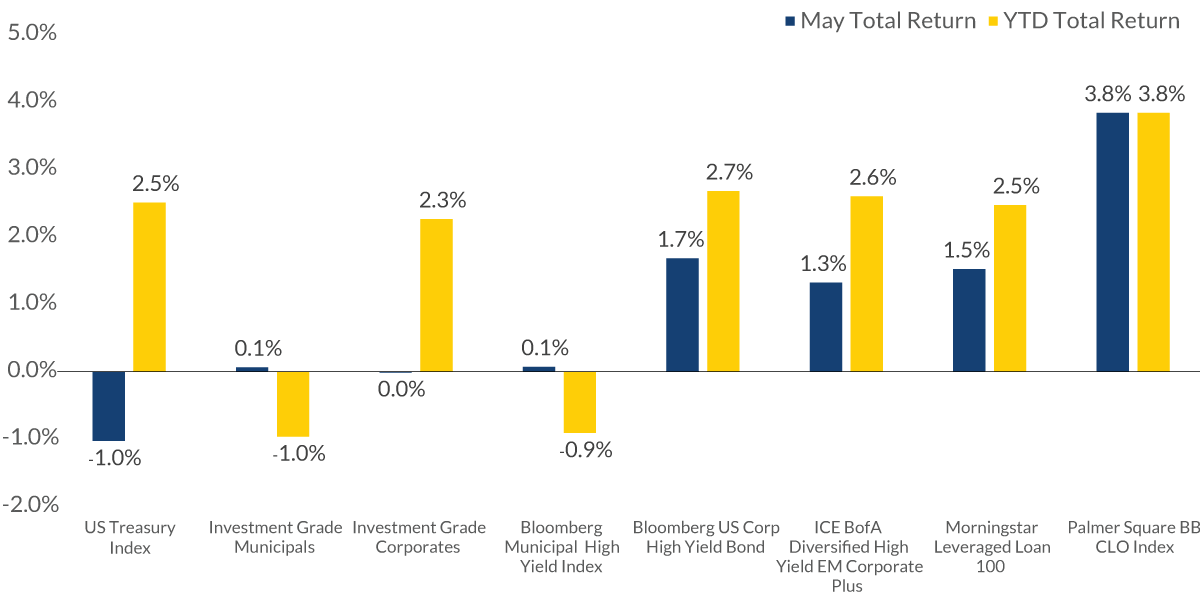
Source: Morningstar Leveraged Loan 100 Index, Bloomberg US Corporate High Yield Index, ICE BofA Diversified High Yield EM Corporate Plus Index, Palmer Square BB CLO Index, Bloomberg Municipal Bond Index, Bloomberg US Treasury Index, Bloomberg High Yield Municipal Bond Index and Bloomberg US Corporate Investment Grade Index as of 5/30/2025.
Information is subject to change and is not a guarantee of future results.
Chart 1, 0:46– These trends have impacted the shape of the U.S. Treasury curve. In May, for example, U.S. Treasury yields increased by about 25 basis points across the curve with the 10-year trading near 4.5% and the 30-year exceeding 5%, as investors demanded a higher premium to own longer-dated bonds.
Against this backdrop of volatility, May delivered the first negative monthly return on the year for U.S. Treasuries. However, year to date, the asset class has rewarded investors with positive returns over 2%.
US Investment Grade and High Yield Corporate Spreads
Source: Bloomberg US Agg Credit Avg OAS Index and Bloomberg US Corporate High Yield Average OAS Index as of 5/30/2025.
Information is subject to change and is not a guarantee of future results.
Chart 2, 1:18– While U.S. Treasuries have been volatile, credit markets have been anything but. If you recall, the market reaction to initial tariff announcements in early April led to some widening in investment grade and high yield corporate credit spreads. However, following the temporary 90-day tariff pause, corporate credit spreads have fallen swiftly back to January levels. This improvement has been supported by steady investment demand as well as positive credit fundamentals.
While there is uncertainty about the timing and magnitude of policy shifts that could have implications for growth, we see valuations as relatively balanced against market risks, but we remain guarded in our credit review and selection process. We continue to believe active management is important in the current environment, and we view the attractive levels of income available today as a value add for well-diversified portfolios.
Shifting our attention to the municipal bond market, we continue to view this sector as a longer-term investment opportunity despite some underperformance this year. The volatility in municipal bond prices has caused yields to rise, making tax-exempt yields more attractive relative to taxable bonds. With the municipal yield curve steep versus comparable U.S. Treasuries, investors can earn excess income by moderately extending maturities and improve forward return potential from increased tax-efficient cash flows.
Fixed Income Asset Class and Maturity Focus Yield Comparison
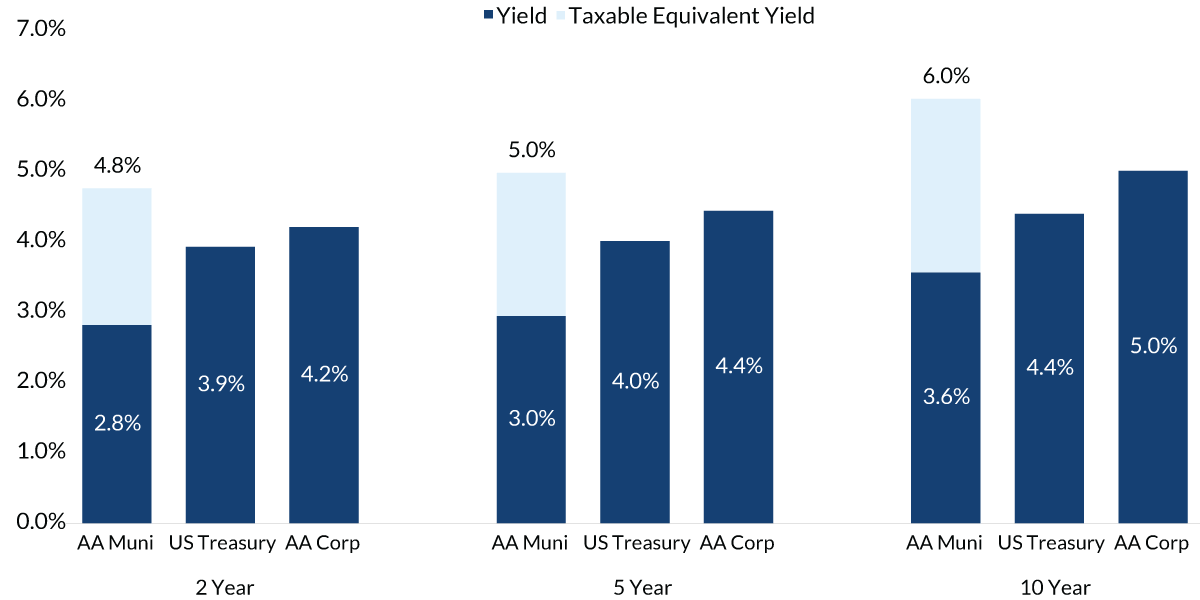
Source: Bloomberg Municipal AA Revenue Bond Index, Bloomberg US Treasury Bond Index, and Bloomberg US Corporate AA Yield Curve as of 6/11/2025.
Yield assumes 37% Federal and 3.8% Medicare surcharge.
Information is subject to change and is not a guarantee of future results.
Chart 3, 2:45– To help illustrate the relative value, a 10-year AA rated revenue bond currently yields about 3.6%. For investors subject to the highest federal tax bracket, this equates to an equivalent yield of approximately 6%, exceeding both comparable U.S. Treasury and AA rated corporate bonds. Also helping make the case is overall credit stability and a continuation of solid investor demand relative to above-average municipal bond supply.
Fixed income markets will be shaped by a mix of economic data and evolving trade policies. Stable underlying macroeconomic conditions, positive momentum on trade negotiations, and clarity surrounding tax policy will continue to improve overall market sentiment. Still, volatility persists across rates, and we maintain our outlook for one to two Fed rate cuts this year with the 10-year yield likely to trade within a 4% to 4.5% range. Despite this, credit conditions remain solid, especially in investment grade municipal and corporate markets where we continue to find opportunities.
Important Information
The views expressed represent the opinions of City National Rochdale, LLC (CNR) which are subject to change and are not intended as a forecast or guarantee of future results. Stated information is provided for informational purposes only, and should not be perceived as personalized investment, financial, legal or tax advice or a recommendation for any security. It is derived from proprietary and non-proprietary sources which have not been independently verified for accuracy or completeness. While CNR believes the information to be accurate and reliable, we do not claim or have responsibility for its completeness, accuracy, or reliability. Actual results, performance or events may differ materially from those expressed or implied in such statements.
All investing is subject to risk, including the possible loss of the money you invest. As with any investment strategy, there is no guarantee that investment objectives will be met, and investors may lose money. Diversification does not ensure a profit or protect against a loss in a declining market. Past performance is no guarantee of future performance.
City National Rochdale, LLC is an SEC-registered investment adviser and wholly-owned subsidiary of City National Bank. Registration as an investment adviser does not imply any level of skill or expertise. City National Bank is a subsidiary of the Royal Bank of Canada.
Fixed Income investing strategies & products. There are inherent risks with fixed income investing. These risks include, but are not limited to, interest rate, call, credit, market, inflation, government policy, liquidity or junk bond risks. When interest rates rise, bond prices fall. This risk is heightened with investments in longer-duration fixed income securities and during periods when prevailing interest rates are low or negative.
Index Definitions:
Bloomberg U.S. Treasury Index: includes all publicly issued, U.S. Treasury securities that are rated investment grade, and have $250 million or more of outstanding face value.
Bloomberg 1-3 Month U.S. Treasury Bill/T-Bill Index (the "Index") is designed to measure the performance of public obligations of the U.S. Treasury that have a remaining maturity of greater than or equal to 1 month and less than 3 months.
Bloomberg U.S. Intermediate Corporate Bond Index measures the performance of U.S. corporate bonds with a maturity of 1–10 years. It's part of the Bloomberg U.S. Corporate Index.
The Bloomberg Municipal Bond: Muni Inter-Short (1-10) Index is a measure of the US municipal tax-exempt investment grade bond market. It includes general obligation and revenue bonds, which both can be pre-refunded years later and get reclassified as such. The effective maturity of the bonds in the index must be greater than or equal to 1 years but less than 10 years.
Bloomberg U.S. Municipal High-Yield Index: covers the U.S.-dollar denominated, non-investment grade, fixed-rate, municipal bond market and includes securities with ratings by Moody’s, Fitch and S&P of Ba1/BB+/BB+ or below.
The Bloomberg US Corporate High Yield Index measures the performance of non-investment grade, US dollar-denominated, fixed-rate, taxable corporate bonds.
ICE BofA Diversified High Yield US Emerging Markets Corporate Plus Index tracks the performance of US dollar denominated below investment grade emerging markets non-sovereign debt publicly issued in the major domestic and Eurobond markets.
The Palmer Square CLO Debt Index (“CLO Debt Index”) (ticker: CLODI) is a rules-based observable pricing and total return index for collateralized loan obligation (“CLO”) debt for sale in the United States, original rated A, BBB, or BB or equivalent.
US Corporate Short 1-5 refers to short-term US corporate bonds with 1–5 years remaining until maturity. These bonds are part of the investment-grade corporate bond market, which is dominated by financial services issuers.
Municipal Short 1-5 refers to a collection of municipal bonds that mature between one and five years. These bonds are a type of debt obligation that pay interest that is exempt from federal income tax.
U.S. Corporate Intermediate 1-10 refers to investment-grade corporate bonds that mature between one and ten years. These bonds are denominated in U.S. dollars and are taxable.
Municipal Short/Intermediate 1-10 is a term used to describe a group of US tax-exempt municipal bonds that have a maturity date between one and ten years. These bonds can be used in a variety of investment strategies, including bond ladders and managed accounts.
© 2025 City National Rochdale, LLC. All rights reserved.
Stay Informed.
Get our Insights delivered straight to your inbox.
Check out previous perspectives:


Put our insights to work for you.
If you have a client with more than $1 million in investable assets and want to find out about the benefits of our intelligently personalized portfolio management, speak with an investment consultant near you today.
If you’re a high-net-worth client who's interested in adding an experienced investment manager to your financial team, learn more about working with us here.